Tour Operator Industry Statistics: Market Trends, Online Presence & Lead Generation

Phurvishaa specializes in crafting travel tech and marketing content, leveraging deep research, SEO expertise, and AI-driven insights. Her strategic approach ensures content that educates, engages and delivers knowledge.
Our authors are proven experts in their fields, writing on topics where they have demonstrated expertise. Every piece of content undergoes peer review and validation by industry professionals.
The tour operator industry is in the middle of a quiet but significant shift growing steadily in revenue while becoming almost entirely dependent on digital discovery, reviews, and online booking to win customers. For tour and activity providers, the businesses pulling ahead aren’t necessarily the ones with the biggest itineraries; they’re the ones with the strongest online presence and the tightest lead-to-booking funnel.
Here’s what the latest tour operator industry statistics reveal about market size, traveler discovery behavior, and what it takes to convert interest into bookings in 2026.
Tour Operator Market: Size & Growth
The numbers show steady, software-driven growth across the sector:
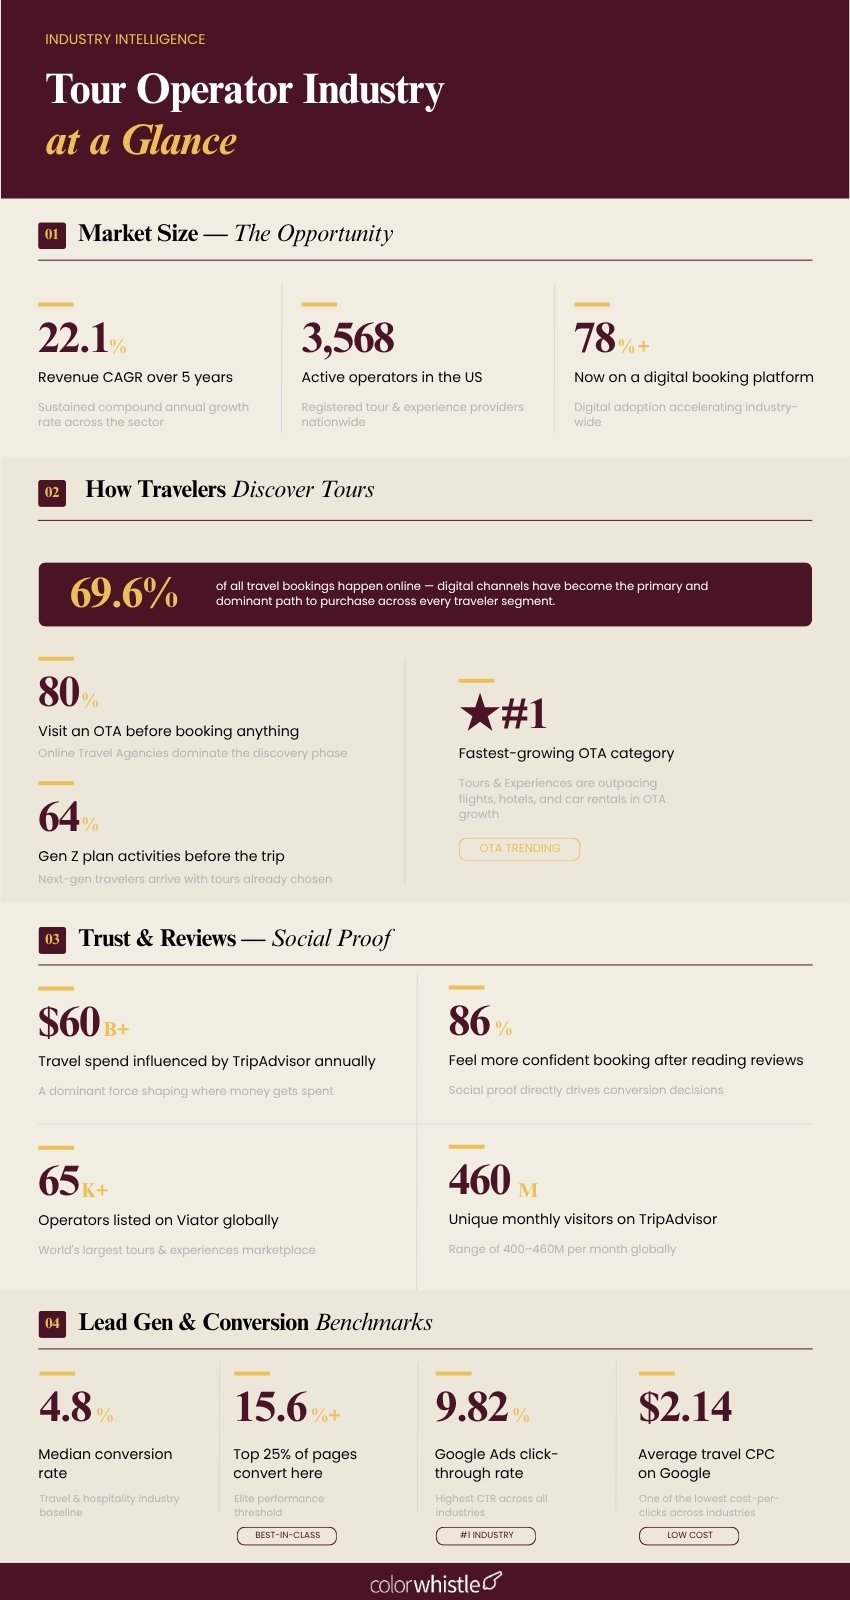
- The US Tour Operators market grew to $12.7 billion in 2026, with the industry posting a 22.1% revenue CAGR over the five years to 2026. (Source: IBISWorld)
- There are currently 3,568 tour operator businesses in the US, reflecting a fragmented, largely small-to-midsize operator landscape. (Source: IBISWorld)
- The global tour operator software market is projected to grow from roughly $0.8–0.9 billion in 2025–2026 to as much as $1.33–2.05 billion by 2030–2035, at a CAGR between 8.5% and 12.2% depending on the forecast model. (Source: Research and Markets, Market Growth Reports)
- Globally, over 78% of tour operators now use at least one digital booking or scheduling platform to manage itineraries, inventory, and customer data, and 72% of total tour reservations are now processed through digital channels. (Source: Market Growth Reports, Market Reports World)
The shift is structural, not cyclical: tour operators are no longer just selling itineraries they’re competing as digital businesses where software, search visibility, and review reputation directly determine revenue.
Also Read
The Online Travel Market: Where Tour Discovery Happens
Tour operators don’t exist in a silo they’re discovered within the broader online travel ecosystem:
- The global online travel market is projected to reach $1.43 trillion by 2034, growing at a CAGR of 9.8%. (Source: Research and Markets via Perk)
- Online bookings now account for 69.6% of the global travel and tourism market, spanning both direct supplier websites and OTAs. (Source: Statista via ElectroIQ)
- Within OTA usage specifically, travelers turn to OTAs for booking hotels (43%), packages (38%), and paid activities (28%) confirming tours and activities are a meaningful, fast-growing OTA category. (Source: Skift via Perk)
- 64% of Gen Z and 57% of Millennial travelers plan and book activities, museums, tours, experiences in advance of their trip, rather than improvising once they arrive. (Source: ToursByLocals via Perk)
Reviews, Trust & the TripAdvisor/Viator Effect
For tour operators specifically, third-party trust signals carry outsized weight in the buying decision:
- TripAdvisor influences an estimated $60+ billion in travel spending annually through research and referrals even when the final booking happens elsewhere. (Source: Wiser Review)
- Tours and experiences are TripAdvisor’s fastest-growing content category, outpacing both hotels and restaurants in review growth as travelers increasingly research activities, not just accommodation. (Source: Wiser Review)
- 400–460 million unique users visit TripAdvisor every month, and the platform hosts listings for over 8.7 million businesses worldwide. (Source: Wiser Review, Viator Operator Resources)
- In an Ipsos MORI study of 23,000 travelers, 86% said TripAdvisor makes them feel more confident in their booking decisions, and 85% said reviews accurately reflected their actual experience. (Source: TripAdvisor / Ipsos MORI)
- Viator, TripAdvisor’s tours and activities arm now works with more than 65,000 operators globally and distributes listings across 4,000+ partner networks, including Booking.com, Expedia, and 240,000+ travel agents. (Source: Viator Operator Resources)
“Reviews are relevant, and trust is high” among the core reasons travelers cite for returning to research-driven platforms before booking tours and activities. – TripAdvisor / Ipsos MORI Global Study.
This makes one thing clear: a tour operator’s owned website reviews, structured testimonials, and review-rich landing pages are no longer optional for trust-builders. They directly compete with the third-party platforms most travelers already trust by default.
Lead Generation & Conversion: Where Operators Win or Lose Revenue
This is the stage most tour operators underinvest in and where the biggest revenue gaps appear:
- The average lead-to-MQL conversion rate across all industries and channels is 31% a useful benchmark for tour operators measuring how many website inquiries is genuinely sales-ready. (Source: First Page Sage)
- Lead conversion rate for travel businesses including tour operators is calculated as confirmed bookings divided by total inquiries; a typical example cited in industry guides shows a travel business converting 12% of inquiries into confirmed, deposit-paid bookings. (Source: CausalFunnel)
- Many travel and tour websites remain poorly optimized for lead capture, forcing a large share of operators to rely on third-party lead vendors with a dynamic that directly suppresses on-site conversion rates industry wide. (Source: Thrive Internet Marketing)
- One agency case study showed a tourism client’s organic conversions grow by over 1,110% (from 6 to 73 monthly bookings) after a structured SEO and content overhaul, alongside a 350%+ increase in organic traffic. (Source: Semrush Agency Directory)
- Conversational channels are outperforming traditional email for tourism lead capture: WhatsApp-based outreach reports open rates exceeding 90%, compared to the typical 20–30% email open rate in hospitality and tourism marketing. (Source: CUFinder)
The pattern across all this data is consistent: tour operators who treat their website as a true lead-generation engine with SEO, structured trust signals, and fast inquiry-to-response workflows convert dramatically more browsers into paying customers than those relying on listings alone.
A strong, conversion-focused website is the foundation of that engine. See what a professionally built travel website actually costs and what features influence lead capture and booking conversion.
Also Read
What This Means for Your Tour Operator Website
Pulling the data together, three priorities stand out for any tour or activity business trying to grow bookings:
Own your reviews, don’t just rent them. With 85%+ of travelers trusting reviews enough to book based on them, your website needs visible, structured social proof not just a link out to TripAdvisor
Treat your website as a conversion funnel, not a brochure. With average lead-to-booking conversion sitting in the low double digits, every unclear CTA, slow load time, or missing inquiry form is lost revenue
Be discoverable everywhere travelers research organic search, OTA listings, and increasingly AI-assisted trip planning tools since nearly 70% of all travel-related bookings now happen online
Whether you’re building a new tour operator’s website from scratch or optimizing an existing one for lead capture, the investment pays back directly in bookings. Explore travel website development services, browse travel website design inspiration, or dig into travel SEO statistics to understand how visibility translates into leads.
Want a tour operator website built to convert visitors into bookings? Talk to ColorWhistle we build travel websites with lead generation, and conversion built in from day one.
FAQs
How big is the tour operator industry?
The US tour operator market was valued at $12.6 billion in 2025, growing to $12.7 billion in 2026, with the broader sector posting a 22.1% revenue CAGR over the past five years.
How important are online reviews for tour operators?
Extremely, TripAdvisor alone influences over $60 billion in travel spending annually, and 86% of travelers say reviews make them feel more confident in their booking decisions.
What percentage of tour and activity bookings happen through OTAs?
Travelers use OTAs for booking paid activities 28% of the time, and tours/experiences are TripAdvisor’s fastest-growing content category, ahead of both hotels and restaurants.