Shopify Store Statistics: Growth, Conversion Rates & Store Performance Benchmarks

With half a decade of experience in creating tech content for education, healthcare, hospitality, and real estate, Nandhini excels at turning complex insights into clear, credible, in-depth, research-backed, and engaging content that helps readers make informed decisions.
Our authors are proven experts in their fields, writing on topics where they have demonstrated expertise. Every piece of content undergoes peer review and validation by industry professionals.
AI Summary
Key Highlights of Shopify Store Growth and Conversion Benchmarks
This post explores current Shopify store statistics to empower merchants with data-driven insights for scaling success. The key insight: understanding conversion rates, cart abandonment, and mobile commerce performance reveals critical growth opportunities. Covering Shopify’s growth, revenue milestones, market share, and conversion benchmarks, it equips store owners and marketers to diagnose issues and optimize checkout, mobile experience, and average order value. Supported by data on BFCM sales records and platform uptime, the post guides merchants to actionable fixes and strategic investments that boost revenue and improve long-term store performance in a competitive e-commerce landscape.
If you’re running a Shopify store or thinking about building one, raw enthusiasm only gets you so far. What separates merchants who scale from those who stall is a clear-eyed understanding of the numbers: how the platform is growing, what conversion rates actually look like across millions of stores, and where the biggest performance gaps are hiding.
This post breaks down the most current, fact-checked Shopify statistics across growth, revenue, conversion, cart abandonment, average order value, and mobile commerce.
Let’s get into it.
If you’re planning to launch or redesign your online store, understanding the typical Shopify website design cost can help you budget effectively and choose the right features for your business goals.
Shopify Platform Growth
Store Count & Merchant Scale
Shopify’s growth story is one of the most remarkable in the history of commerce software. From a small Canadian startup to the world’s leading e-commerce platform, here’s where things stand today:
- 4.82+ million active Shopify stores exist globally as of 2025
- 6.9+ million merchants sell using the Shopify platform when including all plan types
- The platform powers businesses in 175+ countries
- 57.7% of active Shopify stores are based in the United States, making North America the dominant region
- Over 2.8 million stores are located in North America, accounting for roughly 62% of all Shopify stores. Europe follows with around 664,810 stores
- Shopify added +15% new stores in 2023 and +6% in 2024, showing healthy if moderating growth
- The number of active Shopify stores in 2025 Q3 increased by 11.3% year-over-year
Revenue & Financial Performance
- Shopify’s total revenue in 2024 reached $8.88 billion, a 25.8% increase year-over-year
- In 2025, Shopify generated $11.55 billion in total revenue, a 31.55% YoY increase. (Source: DemandSage)
- In Q2 2025, Shopify’s quarterly revenue hit $2.68 billion, up 31.1% year-over-year
- In Q1 2026, Shopify generated $3.17 billion in revenue – its highest quarterly figure to date
- Shopify’s platform revenue has grown more than 40-fold since 2015, from $205 million to nearly $8.9 billion in 2024
- For every $1 in revenue Shopify earns, its merchants earn $40.82
Gross Merchandise Volume (GMV)
GMV represents the total dollar value of all orders processed through Shopify, the clearest signal of how much real commerce flows through the platform.
- Shopify processed $292.28 billion in GMV in 2024, up 24% from $235.91 billion in 2023
- Q2 2025 GMV reached $87.8 billion, a 30.7% year-over-year increase
- Since launching in 2006, over $1.6 trillion in cumulative GMV has been generated through the Shopify platform
Shopify’s Market Share
- Shopify is the #1 e-commerce platform by number of websites, ahead of WooCommerce and Wix
- Shopify commands approximately 30% of the US e-commerce platform market share and 10.32% globally
- Shopify powers 27% of all online stores globally
- 875 million unique online shoppers made purchases from Shopify merchants in 2024, roughly 1 in 3 global online shoppers interacted with a Shopify-powered brand that year
As Shopify continues to evolve, technologies like the Model Context Protocol (MCP) are helping merchants create smarter and more connected shopping experiences. Learn how MCP enhances Shopify stores and improves customer interactions.
BFCM (Black Friday / Cyber Monday) Records
BFCM is the annual performance acid test for the Shopify ecosystem.
- BFCM 2024: Shopify merchants generated $11.5 billion in sales, up 24% year-over-year, with over 70% of purchases made on mobile
- BFCM 2025: Shopify merchants broke all records with $14.6 billion in global sales, a 27% year-over-year increase. Peak sales hit $5.1 million per minute
- 81+ million consumers purchased from Shopify merchants during BFCM 2025
- The average cart value during BFCM 2025 was $114.70 – significantly above the day-to-day average
- Cross-border orders represented 16% of all BFCM 2025 orders, reflecting the growing importance of international commerce
Shopify Conversion Rate Benchmarks
Conversion rate is the percentage of store visitors who complete a purchase. It’s the single most debated metric in e-commerce and one of the most misunderstood.
The Overall Benchmark
- The average Shopify store conversion rate is 1.4% to 1.8% of visitors, as of 2024–2025
- Stores in the top 20% convert at 3.2% or higher. Exceptional performers in the top 10% hit 4.7% or above
- If your store converts at 2%, you are already outperforming roughly 60% of all Shopify stores
- Across the broader e-commerce industry, global average conversion rates sit at 1.9–2%, with Shopify stores typically performing in the 2.5–3% range according to some aggregated datasets
Cart Abandonment: The Biggest Revenue Leak
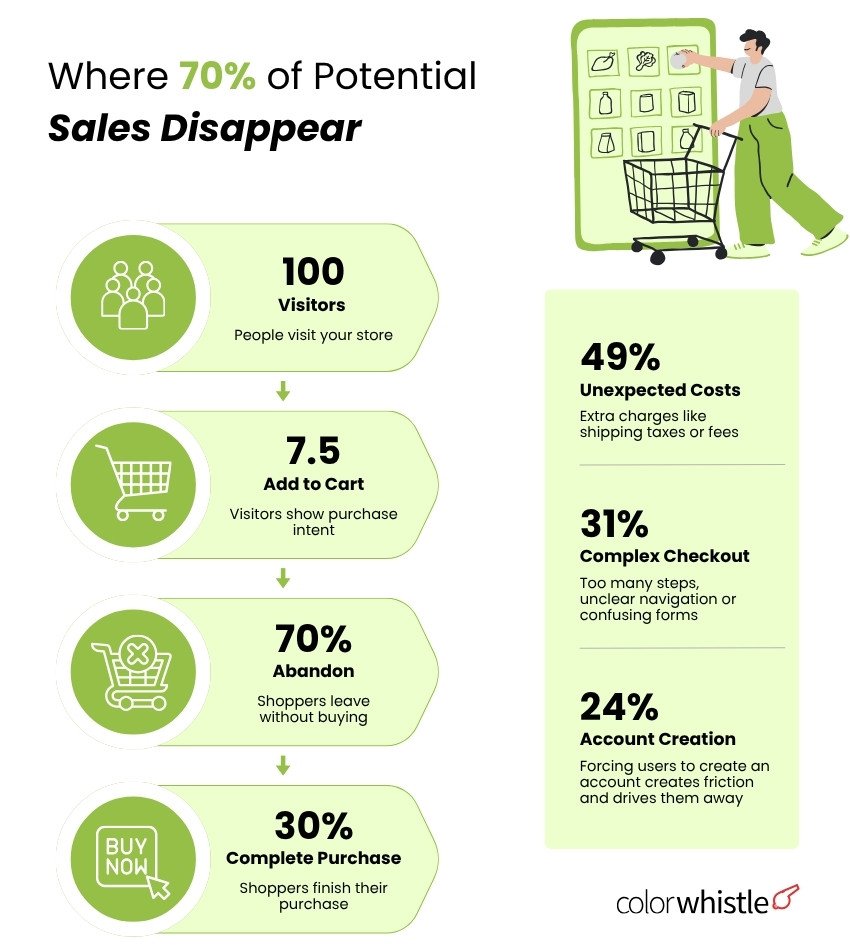
You’ve worked hard to drive traffic. Visitors browse, they add to cart, then 7 out of 10 of them disappear. Cart abandonment is the most universal (and frustrating) reality in e-commerce.
The Benchmark
- The average cart abandonment rate for Shopify stores is approximately 70%, virtually identical to the global e-commerce average of 70.19% reported by the Baymard Institute
- On mobile, abandonment climbs to 75-82%, driven by friction in the checkout process
- Desktop abandonment rates sit around 65–68% – meaningfully better than mobile
- Cart abandonment costs US e-commerce stores an estimated $18 billion annually
Why Shoppers Abandon Carts
Understanding the causes is the first step to fixing them:
- Unexpected extra costs (shipping, taxes, fees): 48–49% of abandonments, the single biggest cause
- Complex checkout process: 31% cite too many steps or form fields
- Required account creation: 24% abandon when forced to register
- Slow page load at checkout: 22% abandon due to speed issues
- Security concerns: 18% don’t trust the site with payment info on mobile
- Lack of preferred payment method: 15% (e.g., no Apple Pay, Google Pay, or Shop Pay)
Source: Easy Apps Ecom | Source: Growth Suite
Every item on this list is a solvable problem. Displaying shipping costs early, enabling guest checkout, and reducing checkout steps are proven, low-effort wins that recover real revenue.
Recovery Opportunity
For businesses looking to improve performance and scalability, a headless commerce approach can be a game changer. Discover how combining Shopify with Strapi helps create flexible and high-performing eCommerce experiences.
Mobile Commerce: The Conversion Gap You Can’t Ignore
Mobile has won the traffic war, the conversion battle is still being fought.
- Mobile devices drive 74-78% of Shopify traffic but account for only 55-62% of revenue due to lower conversion rates
- Mobile conversion rate: 1.4% – 2.0%
- Desktop conversion rate: 3.2% – 4.1%
- During BFCM 2024, over 70% of purchases were completed on mobile – showing that when the experience is right, mobile buyers do convert
- Stores that optimize for mobile speed under 3 seconds and streamline mobile checkout see 35–50% improvements in mobile conversion rates
The mobile conversion gap isn’t a traffic problem, it’s a UX and checkout experience problem. Merchants who close it gain a massive competitive edge.
Store Performance & Merchant Success Benchmarks
Beyond conversion rates and AOV, here’s how Shopify stores perform across other key dimensions:
- The average Shopify store generates approximately $72,000 in annual revenue. Top-performing stores (top 10%) generate over $1 million annually
- Over 100,000 merchants earn more than $1 million in sales annually on Shopify
- The average transaction value for a Shopify order in the US is $81.26
- 5-10% of Shopify stores are considered successful long-term, comparable to broader small business survival rates. Stores that invest consistently in marketing, SEO, and customer experience perform significantly better
- Over 47,000 stores run on Shopify Plus in 2026, and Plus merchants report an average 126% year-over-year growth
- Shopify maintains a 99.9% uptime, making infrastructure failure a non-concern for the vast majority of merchants
App Ecosystem
The Shopify App Store currently hosts 11,905+ apps (as of 2026), giving merchants a deep toolkit for customization, marketing, and automation
Key Takeaways for Shopify Merchants
Here’s what the data tells you to act on:
- On conversion rates: If your store converts below 1.5%, you have a specific problem worth diagnosing, whether that’s traffic quality, product-market fit, checkout friction, or all three. Aim to reach 2% before worrying about scaling traffic
- On cart abandonment: Audit your checkout for unexpected costs, required account creation, and mobile UX friction. Fixing these three issues alone can recover a significant portion of lost sales
- On AOV: You don’t always need more customers. Bundles, free shipping thresholds, and upsells are the fastest path to more revenue from the customers you already have
- On mobile: If 70%+ of your traffic is mobile but mobile revenue is well below that proportion, you have a mobile checkout optimization problem, not a traffic problem
- On success rates: The data shows that 5–10% of stores achieve sustainable success. What separates them isn’t luck, it’s sustained investment in marketing, SEO, customer retention, and conversion optimization
How ColorWhistle Can Help
At ColorWhistle, we specialize in building and optimizing Shopify stores that convert. From performance-focused design to SEO and CRO strategy, our team brings the technical depth and creative thinking that high-performing stores are built on.
Whether you’re launching your first Shopify store or scaling an existing one past the $1M milestone, we help you close the gaps that the data reveals.