Sports Analytics Market Statistics: Growth, Adoption & Tech Trends

Archana's passion for data analysis, statistics, and content creation makes her well-equipped to write insightful, data-driven blogs that transforms complex data into engaging content, helping readers gain deeper insights and take informed decisions.
Our authors are proven experts in their fields, writing on topics where they have demonstrated expertise. Every piece of content undergoes peer review and validation by industry professionals.
AI Summary
Key Highlights of Sports Analytics Market Growth Trends
This post explores the rapid growth and transformative impact of the sports analytics market powered by AI and real-time data. The key insight: the market is projected to quintuple to over $31 billion by 2034, driven by rising adoption across leagues, media, and betting sectors. It serves sports industry professionals and academies aiming to leverage digital tools for competitive advantage. Highlighted are growth forecasts, regional shifts favoring Asia-Pacific, and technological advances like injury prevention AI. Readers gain a clear understanding of market drivers, technology trends, and strategic digital investments needed to stay ahead in the evolving sports analytics landscape.
Sports is no longer driven by instinct alone data now powers every winning move. From player performance to fan engagement, sports analytics is rapidly transforming the industry with AI and real-time insights.
The global sports analytics market crossed $5.68 billion in 2025 and is projected to reach $7.03 billion in 2026 — growing at a compound annual rate of 20.5% through 2034. What was once an edge reserved for elite clubs and billion-dollar franchises is now a standard operating layer across professional leagues, media networks, betting platforms, and national sports programs.
By 2034, the market is projected to surpass $31.14 billion — a 5x increase in under a decade. The broader sports technology market already stands at $34.25 billion in 2025, while the AI in sports layer alone is valued at $7.63 billion in 2025, growing at 27.85% CAGR.
For sports academies, staying competitive means going digital. A well-built Sports Academy Website can help streamline operations, enhance performance tracking, and drive growth in this data-driven era.
$7.03B
Market Size in 2026
Fortune Business Insights, 2025
20.5%
CAGR through 2034
Fortune Business Insights, 2025
$33.32B
AI in Sports by 2031
Mordor Intelligence, Jan 2026
$68.70B
Sports Tech Market by 2030
MarketsandMarkets, May 2026
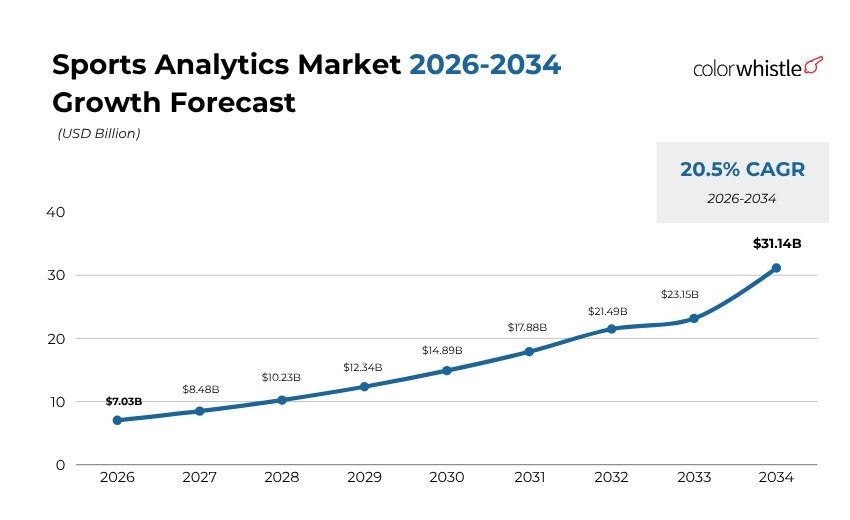
Sports Analytics Market Size Forecast (2026-2034)
The global sports analytics market is valued at $7.03 billion in 2026 and is on a confirmed growth trajectory to $31.14 billion by 2034 at 20.5% CAGR. An independent forecast by Mordor Intelligence puts the 2031 milestone at $17.88 billion at 27.63% CAGR, while The Insight Partners projects $21.43 billion by 2034 at 19.7% CAGR.
All three firms agree: this market more than quadruples between 2026 and 2034.
| Year | Forecast Value | CAGR | Milestone / Key Driver |
|---|---|---|---|
| 2026 | $7.03B | Baseline | Enterprise AI adoption; sports betting analytics boom |
| 2027 | $8.48B | +21% | Wearable + camera hybrid systems mainstream in Tier 1 leagues |
| 2028 | $10.23B | +21% | APAC accelerates; esports analytics becomes standalone category |
| 2029 | $12.34B | +21% | Smart stadium AR standard; automated officiating expands |
| 2030 | $14.89B | +21% | Prescriptive AI coaching live in most professional leagues |
| 2031 | $17.88B | +20% | APAC overtakes North America; mobile-first analytics dominant |
| 2032 | $21.49B | +20% | GenAI standard in broadcast; AI draft/lineup decisions emerge |
| 2033 | $23.15B | +20% | Blockchain fan engagement and smart ticketing at scale |
| 2034 | $31.14B | +21% | Market 4× from 2026; AI fully integrated across all operations |
What Sustains 20%+ Growth Through 2034
- Services growing at 28.11% CAGR 2026–2031 clubs outsourcing analytics ops rather than building in-house
- Betting operators: 28.61% CAGR 2026–2031 as analytics end-users fastest-growing demand segment
- Football/soccer: fastest-growing sport at >20% CAGR 2026–2033
- On-field analysis growing at >19% CAGR 2026–2033; services at 16% CAGR 2026–2033
- APAC projected at 28.5% CAGR; Europe at 25.8% CAGR 2026–2030
- Market forecast to reach $32.58B by 2033 at 24.3% CAGR 2026–2033
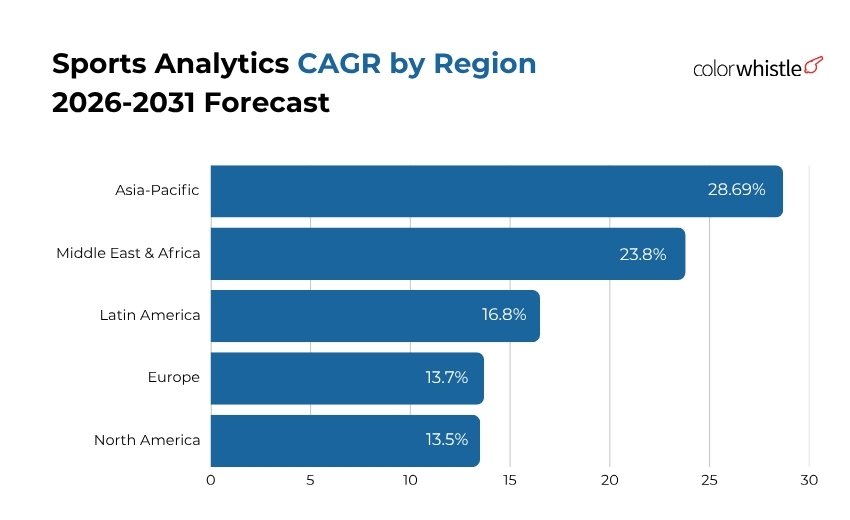
Sports Analytics Market Statistics: Regional Growth Forecasts: 2026–2031
By 2031, the regional rankings will have shifted dramatically. Asia-Pacific — currently the #3 region — grows at 28.69% CAGR and overtakes North America in absolute value. Europe accelerates at 25.8% CAGR on the back of UEFA and top-five football league investment. PwC’s 9th Global Sports Survey confirms Asia as the fastest-growing sports market at 9.4% annually.
| Region | 2026 Value | 2031 Projected | CAGR 2026–31 | Key Growth Driver |
|---|---|---|---|---|
| North America | $2.84B | $5.10B | 13.5% | Betting analytics & media AI |
| Europe | $2.12B | $3.80B | 25.8% | UEFA + Premier League data rights |
| Asia-Pacific | $1.17B | $5.20B | 28.69% | Cricket IPL, esports, mobile-first |
| Latin America | $0.46B | $0.95B | 16.5% | Football leagues, VC inflows |
| Middle East & Africa | $0.28B | 0.83B | 23.8% | Government Vision programmes |
Source : mordorintelligence.com | fortunebusinessinsights.com | grandviewresearch.com | technavio.com | dataintelo.com | insidersport.com
Sports Analytics Market Region-by-Region Outlook
- North America: $2.84B in 2026 → $5.10B by 2031 – NFL, NBA, MLB all standardizing cloud AI analytics platforms
- Europe: 25.8% CAGR 2026–2030 – UEFA and Premier League treating official data as a commercial revenue stream
- Asia-Pacific: 28.69% CAGR 2026–2031 – fastest-growing sports market at 9.4% annually
- APAC AI in sports: 30.60% CAGR 2026–2031 – mobile-first analytics, IPL data ecosystem, esports infrastructure
- Middle East: sports industry forecast to grow 8.7% by 2026 – government-built stadiums deploying AI from day one
- Rugby leads sports type growth at 29.23% CAGR 2026–2031, powered by Sportable’s smart-ball technology
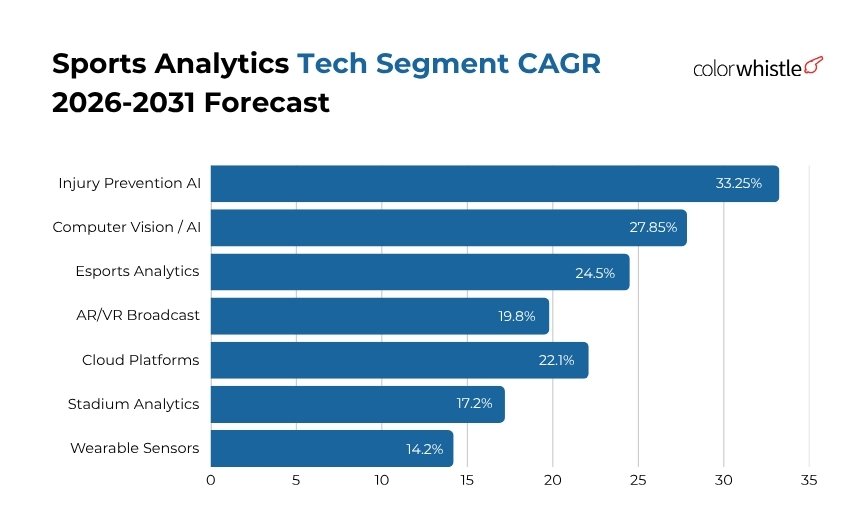
Sports Analytics Market Statistics: Technology CAGR Forecasts: 2026–2031
Injury Prevention AI leads all technology segments at 33.25% CAGR 2026–2031, followed by Computer Vision/AI at 27.85% CAGR. Stadium analytics holds the highest CAGR among infrastructure at 17.2% CAGR. By 2026–2027, MLB is expected to introduce automated strike zones and top football leagues to deploy AI for VAR decisions in real time.
| Technology | CAGR 2026-2031 | 2026 Approx | 2031 Projected | Key Application |
|---|---|---|---|---|
| Injury Prevention AI | 33.25% | ~$1.6B | ~$6.4B | Biometric overload detection, return-to-play AI |
| Computer Vision / AI | 27.85% | ~$2.4B | ~$8.4B | Player tracking, tactical analysis, live feeds |
| Esports Analytics | 24.5% | ~$0.8B | ~$2.3B | Performance data, micro-betting intelligence |
| AR/VR Broadcast | 19.8% | ~$0.5B | ~$1.3B | In-venue AR overlays, VR season tickets |
| Cloud Platforms | 22.1% | ~$1.5B | ~$4.1B | Data lakes, real-time APIs, multi-cloud ops |
| Stadium Analytics | 17.2% | ~$1.0B | ~$2.3B | Fan flow, dynamic pricing, digital twins |
| Wearable Sensors | 14.2% | ~$2.5B | ~$5.0B | GPS, biometrics, positional load monitoring |
Sources: mordorintelligence.com (Jan 2026) | globalnewswire.com | grandviewresearch.com (2025) |coherentmarketinsights.com (2026)
AI in Sports: 2026–2033 Forecast
The AI in sports market starts at $9.80 billion in 2026 and is forecast to reach $50.69 billion by 2033 at 26.5% CAGR.
Grand View Research projects $49.92 billion by 2033 at 21.6% CAGR 2026–2033. By 2026–2027, MLB is expected to deploy automated strike zones and top football leagues to use AI for live VAR decisions. By 2028–2030, AI-suggested draft picks and “AI coaching” become standard across top leagues.
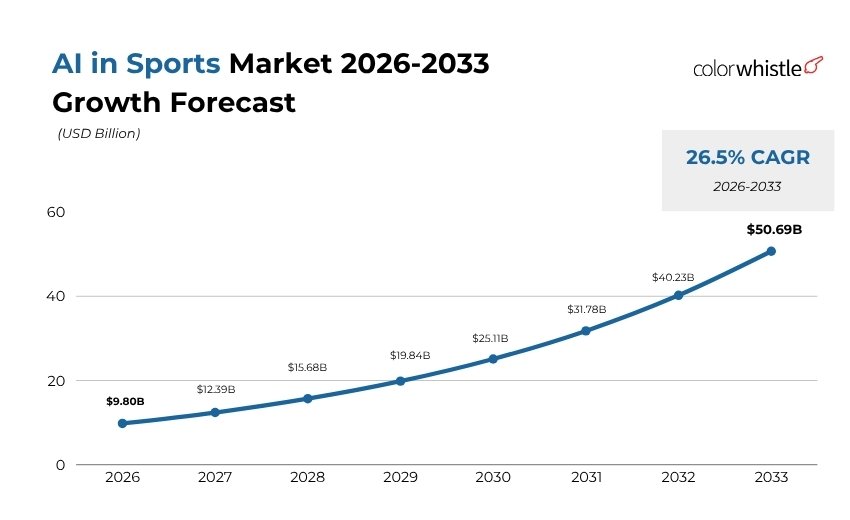
- Projected to grow from $9.80B in 2026 to $50.69B by 2033 at a 26.5% CAGR.
- Grand View Research estimates $49.92B by 2033 at a 21.6% CAGR (2026–2033).
- Injury prevention AI leads growth with a 33.25% CAGR (2026–2031).
- Esports AI follows with a 24.5% CAGR, the fastest-growing sports segment.
- Performance analytics holds 31.70% share of AI applications in sports (2026).
- AI services will surge as demand rises for integration, consulting, and managed infrastructure.
- Deloitte (2026): AI is shifting from experimentation to enterprise-wide deployment, with real-world adoption
2026–2027: MLB adopts automated strike zones; football leagues deploy AI-powered VAR.
2028–2030: AI-driven draft picks and real-time training push youth/college sports AI past $25B.
Performance Analytics Outlook 2026–2030
- Football/soccer: fastest-growing sport at >20% CAGR 2026–2033; on-field analysis at >19% CAGR
- Rugby: 29.23% CAGR 2026–2031 fastest-growing sport type, driven by Sportable smart-ball
- Stadium analytics: 17.2% CAGR 2026–2030 highest infrastructure segment smart venues integrating 5G + digital twins
2026–2027: MLB introduces automated strike zones in regular season; top football leagues deploy AI-powered live VAR
2028–2030: Routine coaching fully AI-assisted with daily plans adapting to real-time biometric data
Fan Engagement & Media Forecast
- Broadcasters & media: fastest-growing sports tech end-user segment at 26.60% CAGR 2026–2034
- Sponsorship rights: 6.9% annual growth; ticketing & hospitality: 6.7% annually
- 91% of executives expect double-digit growth in women’s sport — analytics investment will track this surge
- Venues evolving into year-round community platforms AI operations beyond game days
2026–2027: AR glasses appearing in arenas; teams selling virtual VR season tickets powered by AI personalization
2028–2030: Fully immersive mixed reality broadcasts common; fan AI market toward $25B+ in youth/collegiate sports
What Happens Year by Year: 2026–2030
2026
Enterprise AI deployment. MLB automated strike zones tested. AR glasses in arenas. Betting operators fastest-growing analytics buyer at 28.61% CAGR.
2027
Top football leagues deploy AI for live VAR. Hybrid wearable + camera systems standard in Tier 1 leagues. VR season tickets launch.
2028
APAC accelerates. Daily training plans adapt in real-time to biometric data. Esports analytics a standalone category. Immersive broadcasts begin.
2029
Smart stadium AR overlays standard globally. AI-suggested draft picks emerge. Youth and collegiate analytics adopt AI at scale.
2030
Prescriptive AI coaching live in most professional leagues. Sports tech market reaches $68.70B. APAC nears North America in value.
Sports academies and clubs planning their digital expansion can also benchmark investments by exploring guides like this sports club website cost breakdown to better understand features, structure, and scalability.
Planning your platform? For expert support, connect with ColorWhistle to build a future-ready sports website.