Video Marketing Statistics: Trends, Usage, Video Marketing Insights

Powered by an expert content team, this blog blends SEO precision with compelling storytelling. Every insight is supported by data-driven research, ensuring content that ranks, engages, and drives conversions.
Our authors are proven experts in their fields, writing on topics where they have demonstrated expertise. Every piece of content undergoes peer review and validation by industry professionals.
AI Summary
Key Highlights of Video Marketing Trends and Usage Insights
This post explores the latest video marketing statistics to guide businesses in optimizing strategies for 2026. The key insight: video dominates digital engagement, with over 92% of internet users watching weekly and 89% of companies using video marketing. It covers video types, usage patterns, ROI benefits, and channel preferences, emphasizing short-form videos and mobile viewing. Marketers benefit from increased brand awareness, lead generation, and sales via video. Supported by data on consumer behavior and ad spending trends, the post serves marketers aiming to enhance video content effectiveness and budget allocation to boost conversions and customer trust.
In the rapidly evolving digital landscape, staying ahead means understanding the shifts in consumer behavior and technological advancements. Video continues its undeniable reign, shaping how brands connect, engage, and convert. This isn’t just a fleeting trend; it’s a fundamental transformation of our digital interactions. For businesses aiming to master this domain, partnering with an expert video marketing agency becomes invaluable.
This blog post dives deep into the most compelling video marketing statistics, providing you with the essential video marketing trends that are set to redefine strategies. We’ll explore critical video marketing usage data, offering insights into how audiences are consuming digital video across various platforms. Get ready to uncover the data-backed insights you need to optimize your video content and achieve unparalleled success.
Video Marketing Statistics 2026
- A third of all online activity is spent watching video content.
- 100 million Internet users watch a video online every day.
- 55% of people watch online videos every day.
- Over 1 billion hours of video content are watched on YouTube each day.
- More than 92% of all Internet users across the world watch videos online every week.
- On average, people watch 17 hours’ worth of video content every week.
- More than 90% of consumers between the ages 12 and 44 qualify as digital video viewers.
- There are more than 244 million online video viewers in the United States.
- Online video content currently has a worldwide audience reach of 92.3%.
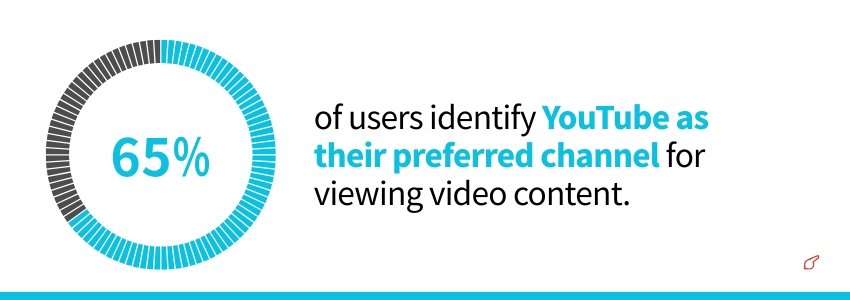
- 65% of users identify YouTube as their preferred channel for viewing video content.
- Over 75% of all online videos are viewed on mobile devices.
- 92% of the people who view videos on mobile devices will end up sharing videos with others.
- 75% of users prefer watching videos in a horizontal format, compared to only 25% who prefer a vertical format.
- 80% of users will click away from a video if it starts to buffer or load slowly.

- 92% of users watch videos with the sound off.
- Users typically retain 95% of the info presented in a video, but they only retain 10% when they read it in text-based content.
Video Marketing Usage 2026
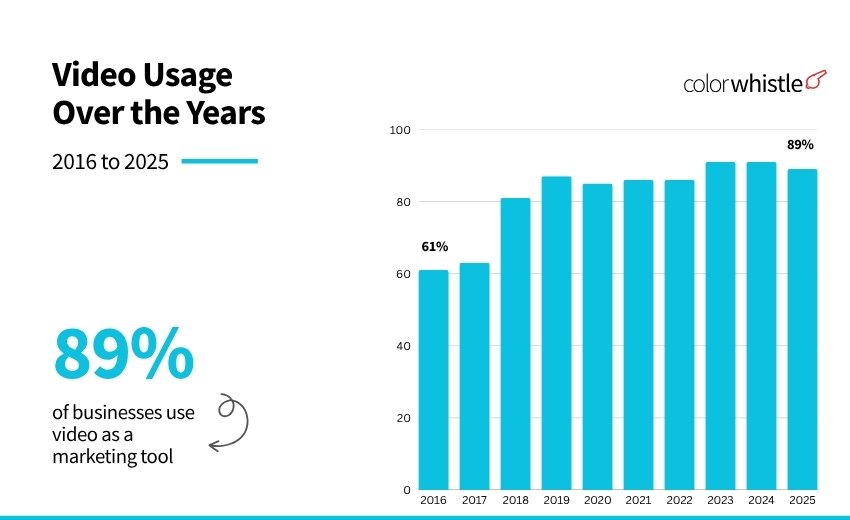
- 89% of businesses use video as a marketing tool.
- 95% of video marketers see video as an important part of their overall strategy.
Types of Videos Created: Key Statistics
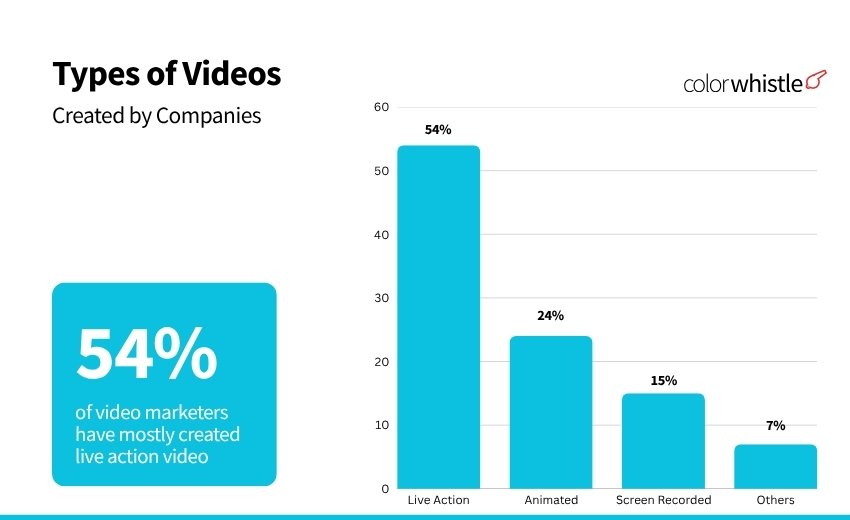
Types of Videos Created by Companies
- Live action video is the most commonly created type of video.
- 54% of video marketers have mostly created live action video.
- This is followed by animated video (24%) and screen-recorded (15%).
Ways Businesses Create Videos
Video is split quite evenly in terms of who creates it.
- Over half of marketers create their videos themselves, in house.
- The rest exclusively use external vendors (14%) or opt for a mix of both (31%).
Use Cases for Videos
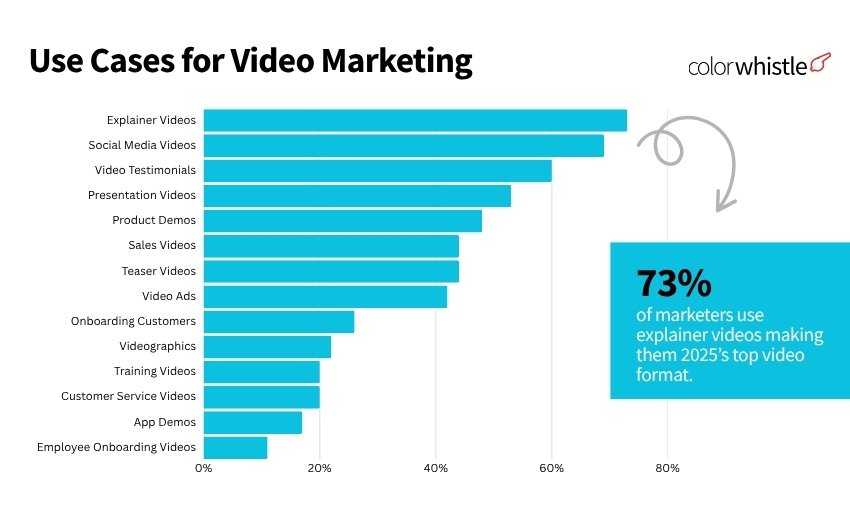
In 2026, explainer videos top the list with 73% of marketers using them, followed closely by social media videos (69%) and video testimonials (60%). These formats dominate because they’re clear, personal, and highly shareable. Other common formats include demos, ads, onboarding, and even internal training videos—proving that video is no longer just for marketing, but for everything.
| Video Type | Video Marketer Usage(%) |
|---|---|
| Explainer Videos | 73% |
| Social Media Videos | 69% |
| Video Testimonials | 60% |
| Presentation Videos | 53% |
| Product Demos | 48% |
| Sales Videos | 44% |
| Teaser Videos | 44% |
| Video Ads | 42% |
| Onboarding Customers | 26% |
| Videographics | 22% |
| Training Videos | 20% |
| Customer Service Videos | 20% |
| App Demos | 17% |
| Employee Onboarding Videos | 11% |
Short-Form Video Statistics 2026
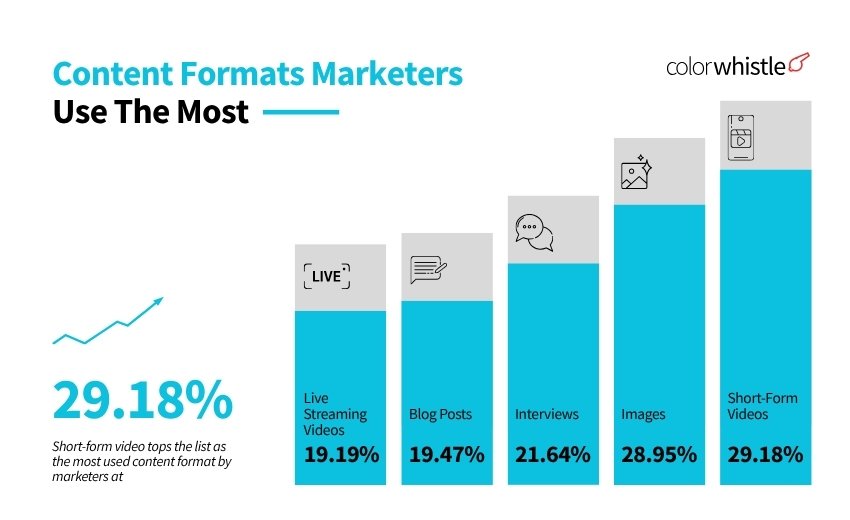
- Short-form videos, including TikTok, Instagram Reels, and YouTube Shorts, are the most widely used video formats by marketers, with 29.18% incorporating them into their strategies.
- 21% of marketers say short-form videos deliver the highest ROI.
- Short-form video is the leading content format marketers intend to prioritize, with 17.13% planning to increase their investment in it.
Product Video Marketing Statistics
- 13.99% of marketers plan to increase their investment in video marketing channels in 2026.
- Around 51% of consumers rely on product videos to make an educated purchase decision

- 96% of marketers agree that videos have helped increase users’ understanding of their product or service
- 96% of people say they watch explainer videos to learn more about a product, and 89% report having been swayed to purchase
AI in Video Marketing Statistics
This is almost an even split. 51% of video marketers say they’ve used AI tools to help them create or edit marketing videos, while 49% have not.
Video Marketing Financials Statistics
- Most marketers (53%) allocate a third of their budget (or less) to video content. And surprisingly, 14% are not tracking the data and are unsure how much they spend!
- Most marketers (93%) plan on spending around the same or more on video marketing in 2026.
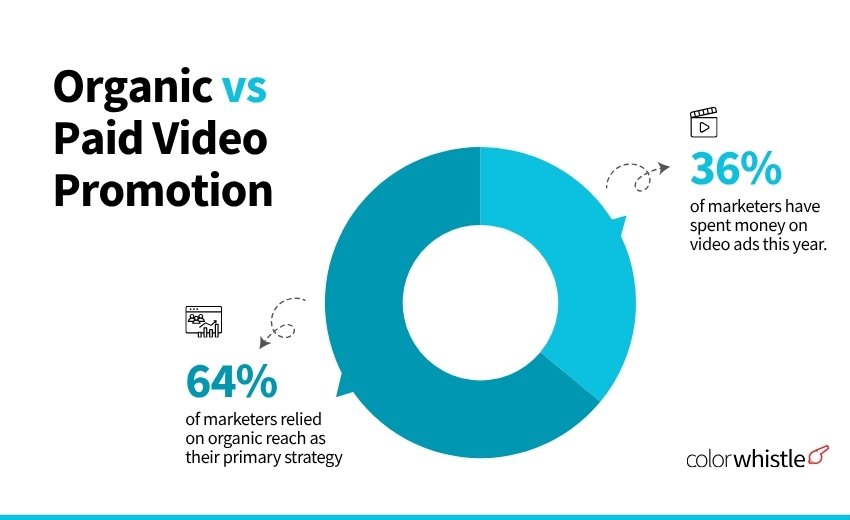
- 36% of marketers have spent money on video ads this year. But the majority (64%) relied on organic reach.
- Responses on video marketing costs were mixed. 36% believe the costs associated with video marketing are getting cheaper, and a further 36% said they noticed no change. While 28% said costs are increasing.
- 21% of marketers feel the costs of video marketing are staying pretty much the same.
Video Marketing ROI Statistics
- 93% of marketers say video marketing has given them a good ROI – that’s the highest since we started recording this data!
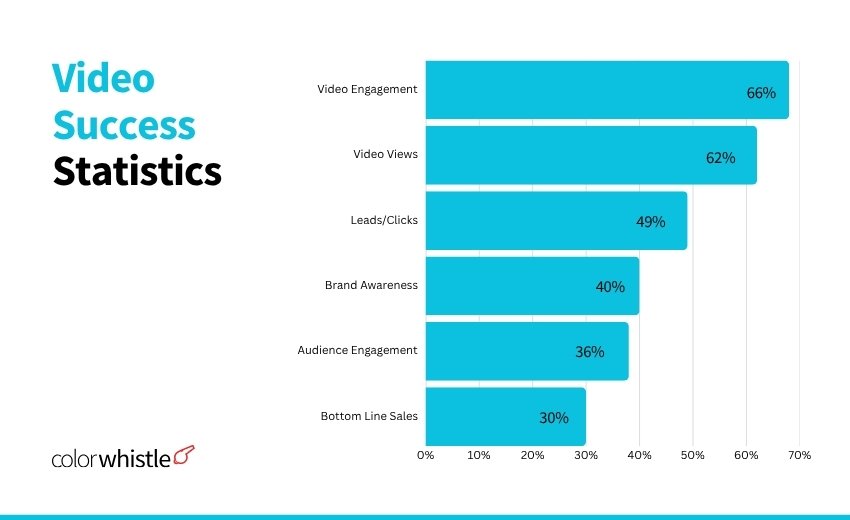
Video Success Statistics
- 66% of video marketers quantify ROI through video engagement such as likes, shares and reposts.
- 62% of video marketers quantify ROI through video views.
- 49% of video marketers quantify ROI through leads/clicks.
- 40% of video marketers quantify ROI through brand awareness/PR.
- 36% of video marketers quantify ROI through customer engagement and retention.
- 30% of video marketers quantify ROI through bottom line sales.
- Most people (73%) believe videos between 30 seconds and 2 minutes are most effective.
- 99% of video marketers say video has helped to increase user understanding of their product or service – this is another all-time high!
- 96% of video marketers say video has helped them increase brand awareness. Up from 90% in our 2024 report.
- 82% of video marketers say video has helped them increase web traffic – a slight decrease.
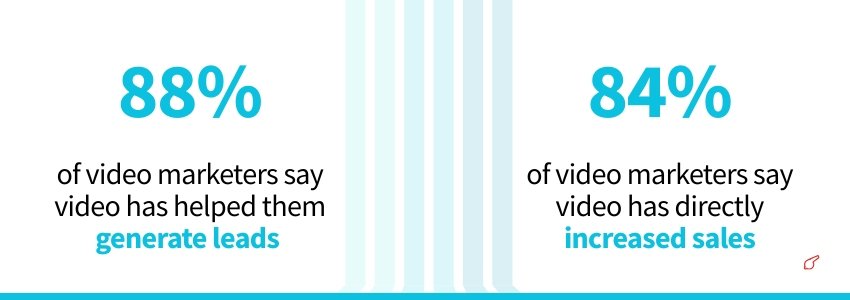
- 88% of video marketers say video has helped them generate leads
- 84% of video marketers say video has directly increased sales.
- 84% of video marketers say video has helped keep visitors on their website longer (aka dwell time).
- 62% of video marketers say video has helped them reduce support queries.
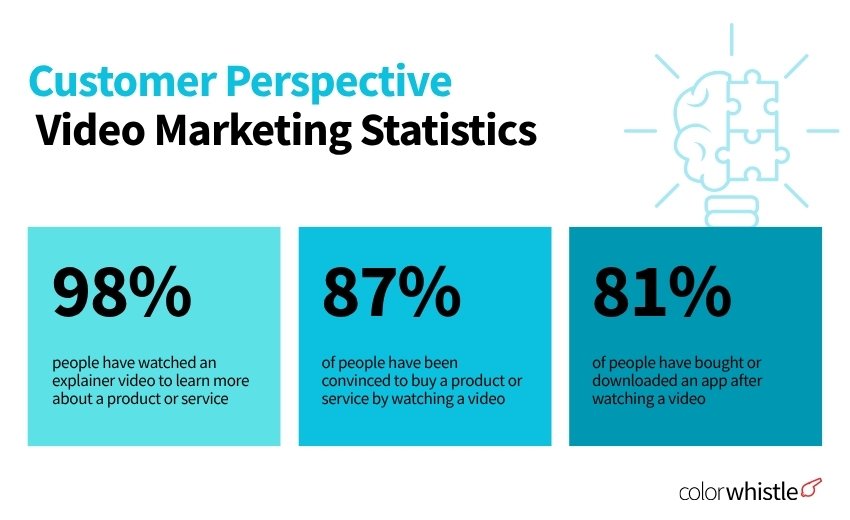
Customer Perspective Video Marketing Statistics
- 98% of people have watched an explainer video to learn more about a product or service an all-time high!
- 87% of people have been convinced to buy a product or service by watching a video not quite an all-time high, but another increase.
- 81% of people have bought or downloaded an app after watching a video about it another all-time high for this data.
- 83% of consumers want to see more videos from brands in 2026 – if we call out the all-time highs, we have to call out the all-time lows too, right? Although this figure is still pretty great for video marketers!
- 91% of consumers say video quality impacts their trust in a brand. Up from 87% in our 2024 report.
- When asked how they’d like to learn about a product or service, 78% say they’d most like to watch a short video.
- This comfortably beats off other materials such as text-based articles (9%), ebooks or manuals (5%), infographics (3%), sales calls (2%) or webinars/presentations/pitches (3%).
Video ad Spending Statistics
- The average ad spending per internet user in the Digital Video Advertising market is projected to be US$1.40 in 2026.
- Connected TV ad spending in the Digital Video Advertising market is expected to reach US$80.54m in 2026 and is forecasted to grow at a CAGR of 3.67%, resulting in a market volume of US$93.02m by 2029.
- Ad spending in the Digital Video Advertising market in India is forecasted to reach US$1.43bn in 2026.
- The sector is expected to experience a Compound Annual Growth Rate (CAGR 2026-2029) of 5.75%, leading to an estimated market size of US$1.79bn by 2029.
- With a projected market size of US$93.88bn in 2026, the majority of revenue will be generated the United States.
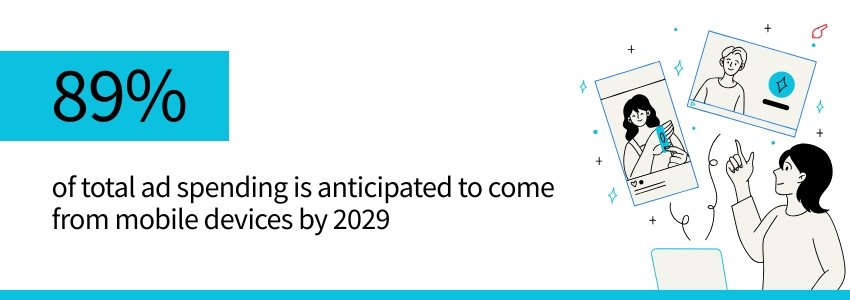
- Within the Digital Video Advertising market, 89% of total ad spending is anticipated to come from mobile devices by 2029.
- Ad spending on short-form videos in the Digital Video Advertising market is projected to reach US$541.60m in 2026 and is expected to increase at a CAGR of 6.28%, leading to a market volume of US$690.91m by 2029.
- India’s Digital Video Advertising market is booming, driven by the country’s tech-savvy population and increasing internet penetration rates.
Channel-Specific Video Marketing Statistics
- When asked which social formats they’ll invest more in 2026, the top three responses were YouTube (29.58%), Instagram (28.84%), and TikTok (27.64%).
- Short-form videos, like TikTok, Instagram Reels, and YouTube Shorts, are the most commonly used video formats among marketers, with 29.18% leveraging them in their roles. Additionally, 19.19% of marketers incorporate live streaming in their content mix.
- On TikTok, most top publishers uploaded videos shorter than 30 seconds. However, videos between 5 to 10 minutes got the highest average views
- TikTok ad videos with captions get an extra 95% boost in brand affinity, a 58% increase in recall, and a 25% jump in uniqueness.
- 78% of LinkedIn videos are shot with a smartphone, while 22% are shot using professional gadgets.
- 65% of LinkedIn in-feed videos don’t have a CTA. However, the most common CTAs are “Follow for more tips” (19%), “Check the link in my bio” (10%), and “Comment your thoughts” (6%)
- 97% of LinkedIn videos are vertical.
Video Marketing Statistics by Industry
- Global spending on digital video advertising has accelerated since 2017, when the total spend was just under $35 billion. A rise of over 53% took spending past $50 billion in 2018 ($53.43 billion), with this figure nearly doubling by 2020 ($106.5 billion).
- Industry spending is expected to continue growing for the rest of the decade, albeit at a slower pace. A projected 7.7% increase in 2026 is set to push spending past $220 billion ($223.5 billion), with this figure reaching $239.1 billion by 2026 (+7%).
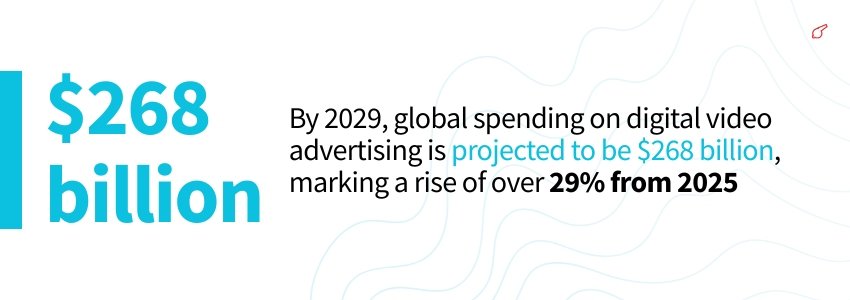
- By 2029, global spending on digital video advertising is projected to be $268 billion, marking a rise of over 29% from 2026. If projections prove correct, then global spending on digital video advertising will be over seven times more in 2029 than in 2017.
- Spending is expected to grow at a slower rate beyond 2026, reaching $122.5 billion in 2026 (+10.2%) before exceeding $134 billion a year later (+9.6%). By 2029, the total expenditure on short-form digital video advertising is projected to reach $157.5 billion, marking a rise of over two-fifths (41.9%) from 2026.
- The average global spend on digital video advertisements is projected to be nearly $35 per internet user in 2026up 2.3% from the previous year ($33.59.) At the same time, the global spend on short-form digital ads is projected to reach $17.46, marking a year-on-year rise of almost 6%.
What Video Content Formats Are Trending Now?
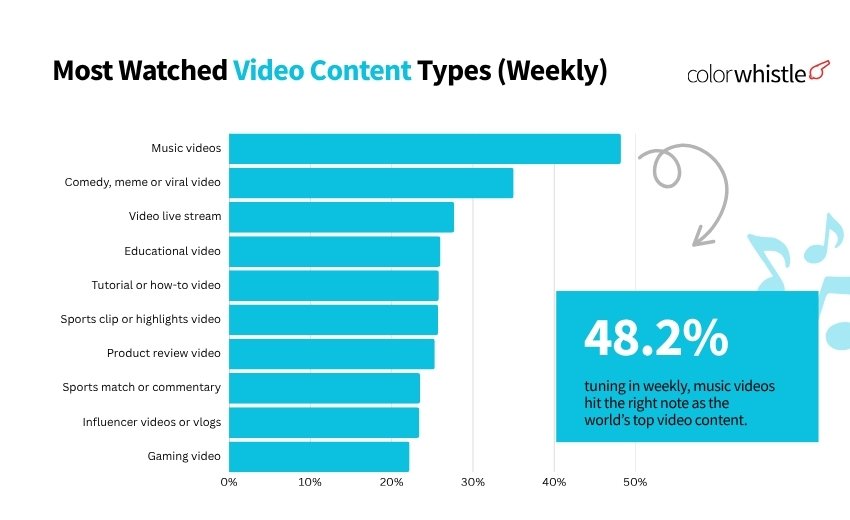
Statista’s Q4 2024 data reveals that music videos were the most frequently watched online content among internet users. Globally, almost half (48.2%) of users reported viewing music videos weekly, a preference that was over 13% more common than any other video content type.
Comedy, memes, and viral content secured the second spot, with 35% of users engaging with these videos weekly. This category’s popularity exceeded others by more than 7%, marking it as the final content type to attract over a third of internet users each week.
Video live streams captured the attention of 27.7% of weekly viewers, making them the third most popular video content type. This figure was almost 2% higher than that for educational videos, which were watched by 26% of users.
Additionally, three other categories of video content were viewed weekly by more than a quarter of internet users:
Tutorial or how-to videos (25.8%)
Sports clips or highlight videos (25.7%)
Product review videos (25.3%)
On the lower end of the spectrum, just over 22% of internet users engaged with gaming videos on a weekly basis. This was a little more than 1% less than the viewership for influencer videos and vlogs.
Video Content Type vs Percentage of Global Internet Users Who Watch Weekly
| Video Content Type | Percentage (%) |
|---|---|
| Music videos | 48.2% |
| Comedy, meme or viral video | 35.0% |
| Video live stream | 27.7% |
| Educational video | 26.0% |
| Tutorial or how-to video | 25.8% |
| Sports clip or highlights video | 25.7% |
| Product review video | 25.3% |
| Sports match or commentary | 23.5% |
| Influencer videos or vlogs | 23.4% |
| Gaming video | 22.2% |
Best Practices: Video Marketing Statistics
- 31% of businesses publish two to four videos each month.
- 65% of companies add captions to their videos for accessibility.
- Due to short attention spans, marketing videos need to grab viewers’ attention in 2.7 seconds or less.
- 81% of companies find that including some kind of music in their videos helps them to perform better.
- 66% of companies report that using voiceovers in their videos helps them to perform better.
- 24% of marketers believe that videos are more likely to go viral if they use humor.
- 60% of marketers named engagement as the most important video marketing metric to track.
- 36% of marketers say that the most important factor when creating video content is capturing users’ attention in the first few seconds.
- 42% of companies say their videos have improved as a result of partnering with an external agency.
Reasons For Not Using Video Marketing
- The biggest barrier to adopting video marketing is that most marketers (37%) simply don’t know where to start!
- Lack of time also remains a big barrier to video marketing adoption. Over a quarter of marketers who don’t use video say it’s because they don’t have enough time.
- 16% of marketers who don’t use video are unclear on the ROI of video marketing.
- 11% of marketers who don’t use video say it’s too expensive.
- 5% feel unable to convince key decision-makers.
- And a further 5% of marketers who don’t use video don’t feel they need video in their marketing strategy. BUT…
- 68% of marketers who don’t use video say they plan to start using video in 2026
Top 5 Video Marketing Trends in 2026
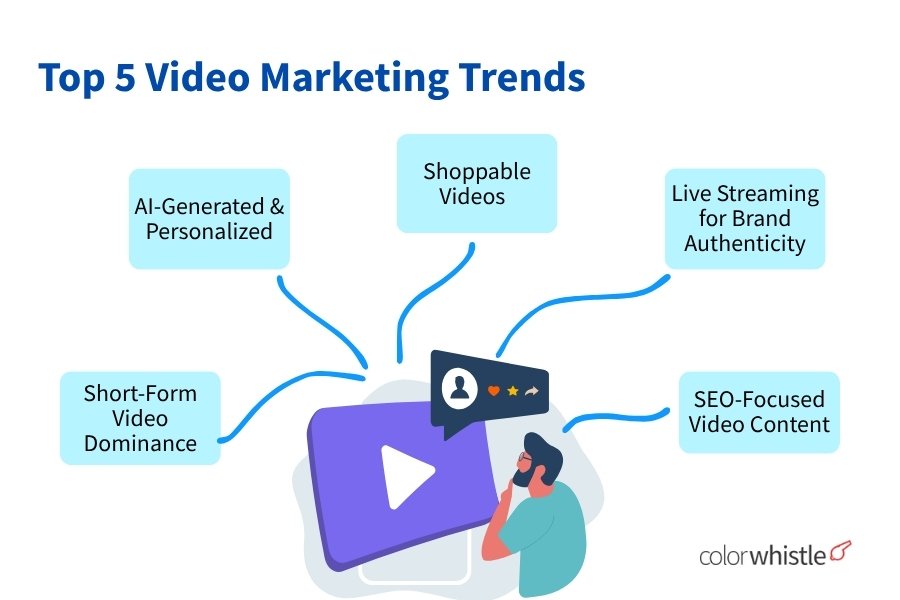
Short-Form Video Dominance
Platforms like Instagram Reels, YouTube Shorts, and TikTok continue to dominate. Short, snackable content (15–60 seconds) is outperforming long-form in engagement and reach, especially among Gen Z and Millennials.
Why it matters: Higher completion rates, more shares, and better brand recall.
AI-Generated & Personalized
Videos AI tools are enabling dynamic personalization — tailoring videos based on user behavior, location, or interests.
Example: Sending a personalized video ad with the viewer’s name or preferences boosts click-through rates significantly.
Shoppable Videos
Interactive videos with clickable products let viewers shop directly while watching — especially popular in retail, fashion, and beauty.
Platform boost: Instagram, YouTube, and even Amazon Live are investing heavily in this trend.
Also Read
Live Streaming for Brand Authenticity
Live video builds trust and boosts engagement. Brands are using it for:
- Product launches
- Behind-the-scenes access
- Q&A sessions
- Collaborations with influencers
80% of consumers prefer watching live video over reading a blog post.
SEO-Focused Video Content
More marketers are optimizing videos for search with better titles, transcripts, and descriptions. Google is prioritizing video content in search results, including “key moments” in YouTube videos.
Tip: Use subtitles, video chapters, and rich metadata to improve discoverability
Also Read
The insights gleaned from these video marketing statistics and trends clearly underscore the undeniable power of digital video in today’s landscape. By understanding current video marketing usage and leveraging key digital video statistics, businesses can craft highly effective strategies that truly resonate with their audience and drive significant results.
Ready to transform these insights into action and elevate your brand’s video presence? Whether you’re looking to create compelling video content or need a comprehensive video marketing strategy, the experts at ColorWhistle are here to help. Don’t miss out on the opportunities video offers. Contact Us Today to discuss your needs, or Request a Quote for tailored services. You can also reach us directly at +91-94427-89110