")
Kitchenware, Kitchen Appliances, Kitchen Furniture – Kitchen eCommerce Statistics (Updated for 2026)

Archana’s expertise in data analysis, statistics, and content creation enables her to craft insightful, data-driven blogs. In this blog, she presents key kitchenware eCommerce statistics from 2023 to 2026, simplifying complex data to help readers understand market trends and make informed business decisions.
Our authors are proven experts in their fields, writing on topics where they have demonstrated expertise. Every piece of content undergoes peer review and validation by industry professionals.
AI Summary
Key Highlights of Kitchen eCommerce Statistics 2026
This post explores critical eCommerce statistics for the kitchen industry, aiming to educate businesses on market trends and consumer behavior. The key insight: kitchen appliances, furniture, and kitchenware markets are rapidly growing, driven by smart appliance adoption and online purchasing. It covers market sizes, growth rates, and technology use, like AI in commercial kitchens. Readers, primarily eCommerce entrepreneurs and marketers, gain data-driven guidance to optimize online platforms and boost sales. Supported by detailed revenue forecasts and consumer habits, this analysis helps businesses build competitive, user-friendly kitchen eCommerce sites and capitalize on emerging digital opportunities.
The kitchen industry stands out as a dynamic and rapidly growing sector in the world of eCommerce. From kitchen appliances to culinary tools, the digital marketplace is transforming how consumers shop for their kitchen needs. Whether you are in the process of creating an eCommerce website or seeking to enhance your existing platform, staying informed about kitchen industry statistics is essential.
Here is an in-depth analysis of eCommerce statistics for the kitchen industry, that helps you discover insights to build a successful eCommerce website.
TL; DR
- Kitchenware eCommerce Market Overview – Covers the rising demand for kitchenware in online markets.
- Global Kitchenware eCommerce Statistics – Discusses worldwide market trends and the rapid growth of smart kitchen appliances.
- Kitchenware eCommerce Growth in the USA – Explains the expansion of online kitchenware sales in the U.S. market.
- Kitchenware eCommerce Growth in India – Highlights the steady rise of India’s kitchenware eCommerce sector.
- Key Drivers of Growth in Kitchenware eCommerce – Breaks down factors like changing lifestyles and increasing disposable income.
- Opportunities for Kitchenware Businesses – Explores how brands can leverage eCommerce growth for success.
Kitchen Appliances Statistics for 2026
General Statistics for Kitchen Appliances
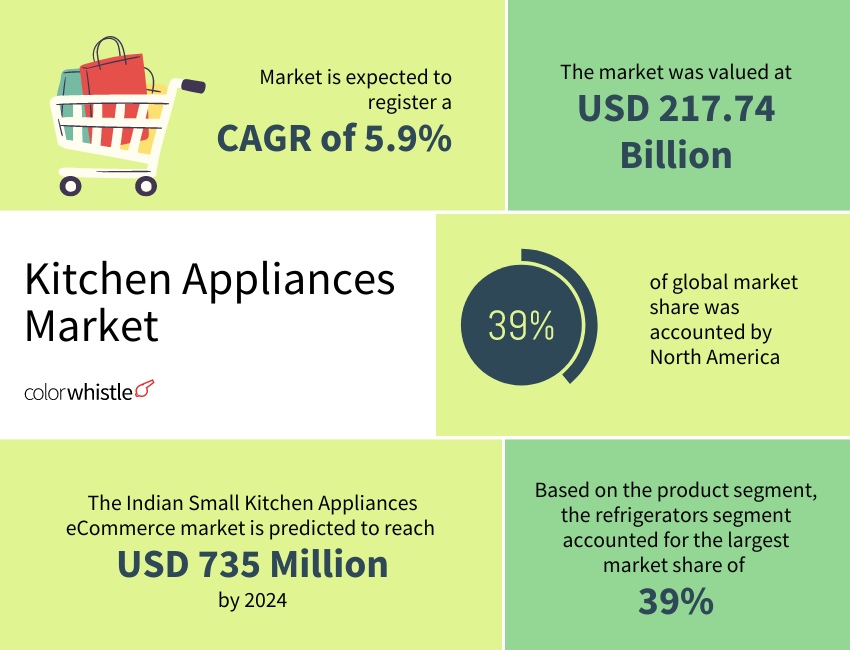
The global kitchen appliances market size was valued at USD 323.43 billion in 2026 and is expected to grow at a compound annual growth rate (CAGR) of 4.02% from 2026 to 2031.
- The appliancesonline.com.au website is ranked by traffic. It received almost 1.8 million total visits in 2024, a decrease of 28.34% from last month.
- Between 2024 and 2028, the worldwide revenue created by ‘Microwave Ovens’ increased by $1,6 billion, or 16.68%, indicating a 16.68% market share.
- According to the Kitchen Appliances Statistics, revenue in the ‘Smart Appliances’ section has consistently grown and was valued at $39.6 billion between 2024 and 2028. Around 75% of the population in Spain, Sweden, France, Germany, and Australia have a coffee machine, but in South Africa, around 27% of the people own a coffee machine.
- In the U.S., almost 80% of households are using a refrigerator and a microwave.
- The smart appliance industry is growing rapidly; in the United States alone, almost 17 million users own a smart appliance.
- In the U.S., the industrial value of household appliances is predicted to be at $70 billion between 2024 and 2028, with an increase of 12.81%.
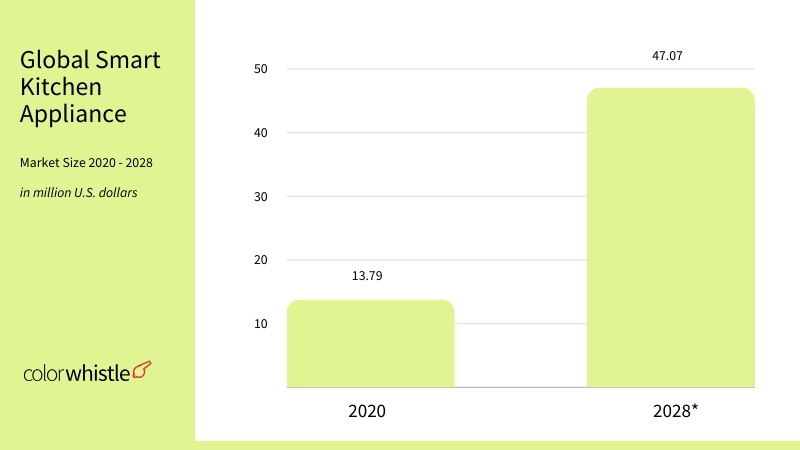
- The smart kitchen appliance market is set for significant growth from 2020 to 2028.
- In 2020, this market was valued at approximately $13.79 billion, with projections indicating it will reach over $47 billion by 2028, growing at a compound annual growth rate (CAGR) of 19.2%.
- The Indian Small Kitchen Appliances eCommerce market is predicted to reach US$735.0 million by 2024
Also Read
Commercial Kitchen Statistics for 2026
General Commercial Kitchen Statistics
Market Value in 2025
USD 104.97 Billion
Revenue Forecast in 2030
USD 149.34 Billion
Growth Rate
CAGR of 7.3% from 2025 to 2030
Source: Grand View Research
Commercial Kitchen Website Statistics for 2026
- 72% of operators have a website for their restaurant
- 81% of restaurateur use Facebook to promote their business, making it the #1 social media site for restaurant marketing in the U.S.
- 90% of guests research a restaurant online before actually going there. This is a practice done more in this business type compared to others
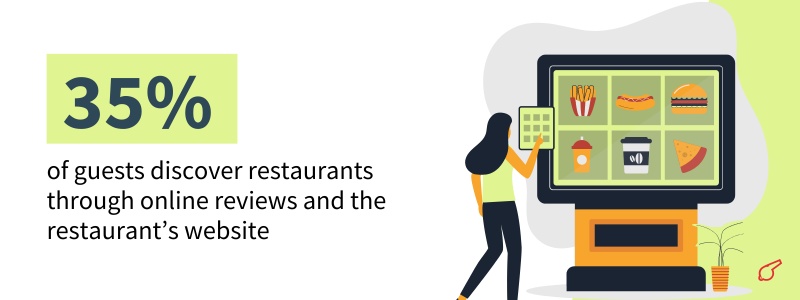
- 35% of guests discover restaurants through online reviews and the restaurant’s website.
- 70% have been discouraged from visiting the restaurant because of its website.
- 69% said a restaurant’s website helps them decide if they want to dine in, while 43% visit the website to decide if they want to order takeout or delivery.
- MGH also found that 33% of consumers were discouraged by a difficult-to-navigate website, and 30% were because the restaurant’s website looked old or out of date.
- A new survey from MGH found that 77% of diners visit a restaurant’s website before they dine in or order out from the establishment. Of that group, nearly 70% have been discouraged from visiting the restaurant because of its website, according to a press release.

- Of 1,101 U.S. adults surveyed, the vast majority of diners (69%) said a restaurant’s website helps them decide if they want to dine in, while 43% visit the website to decide if they want to order takeout or delivery.
Did you know?
Chipotle is a case study here.
The chain’s website won a Webby Award in 2017 for its responsive web ordering feature. Coincidentally, the chain is now a standard-bearer of digital ordering, generating 18.2% of all Q2 sales through mobile and online channels — a 99% increase from the same period last year. The company also clocked a 10% comparable sales increase during the quarter, well above the average for the industry.
- First impressions are critical when it comes to restaurants, which is why most consumers would swear off an establishment if it had dirty bathrooms (82%), tables (74%) or floors (66%) or outdated decor (60%), according to research from Zoro. A website’s presence is no different, especially as most customers go there first.
Source: Restaurantdive | Marketpath
Statistics on AI & Technology in Commercial Kitchens for 2026
- 95% of operators use some form of AI in their restaurant
- 50% of restaurateurs have automated inventory management in their restaurant
- 70% of restaurateurs have automated payroll at their restaurant
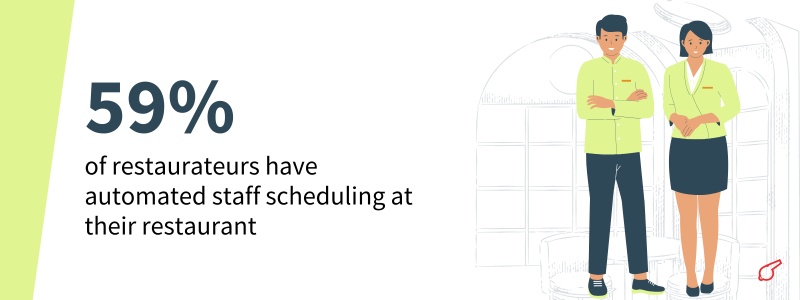
- 47% of restaurateurs have automated staff scheduling at their restaurant
- 37% of restaurateurs say the biggest barrier to automation is the high upfront cost
- 76% of restaurants use a cloud-based POS system, while 34% report using a legacy POS system
- 54% of restaurateurs changed their POS system in the past year
- 40% of restaurateurs say ease of use is the most important factor when choosing a POS
- 33% of restaurateurs say customers support is the most important factor when choosing a POS
- 95% of restaurants use at least one online ordering platform, and on average, most use three platforms
- 11% of diners want the option to text their orders
- 40% of diners want the option to pre-schedule pickup and delivery orders

Kitchen Furniture Statistics for 2026
General Statistics for Kitchen Furniture
- Between 2023 and 2028, kitchenware is predicted to earn a revenue of $25.1 billion.
- The global Kitchen Furniture market looks promising in the next 5 years. As of 2022, the global Kitchen Furniture market was estimated at USD million, and it’s anticipated to reach USD million in 2028, with a CAGR during the forecast years.
- According to the Bureau of Labor Statistics survey, the average consumer expenditure on non-electric kitchenware has reduced from $32.3 in 2021 to $28.3 per consumer unit in 2022.
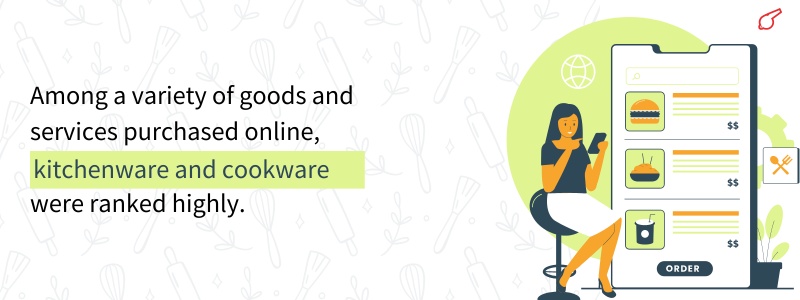
- Among a variety of goods and services purchased online, kitchenware and cookware were ranked highly. Some 41% said they have bought such products online during the past year.
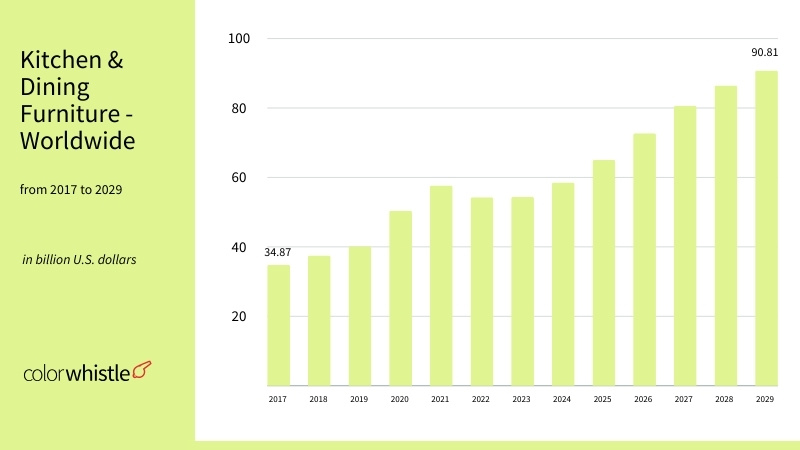
- Revenue is expected to show an annual growth rate (CAGR 2024-2029) of 9.17%, resulting in a projected market volume of US$90.81bn by 2029. With a projected market volume of US$32,150.00m in 2024, most revenue is generated in the United States.
Source: Metricscart | Plma | Linkedin | Statista
Top Payment Gateways in Europe features the region’s most reliable payment providers.
Kitchen Furniture Statistics in The USA
- The United States is by far the leading importer of kitchen furniture worldwide for a long time, importing US$ 3 billion worth of kitchen furniture in 2022. Vietnam, Canada and Malaysia are the main suppliers of kitchen furniture to the American market. Around 200 million USD of imports from Italy and Germany.
- The U.S. Furniture & Homeware eCommerce market is predicted to reach US$114,603.6 million by 2024 and accounts for 10.8% of the total eCommerce market in the United States. It is expected to increase over the next years.
- The expected compound annual growth rate for the next four years (CAGR 2024-2028) will be 7.0%, resulting in a projected market volume of US$149,986.4 million by 2028.
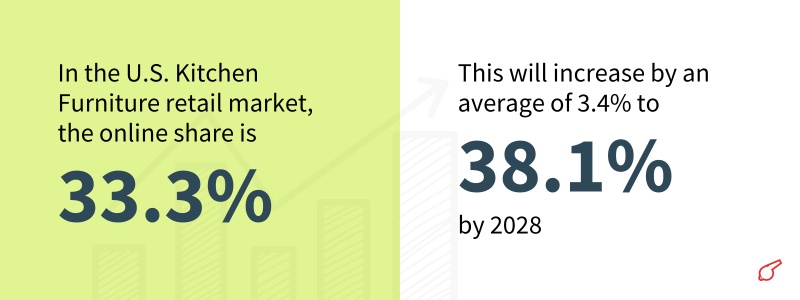
- In the U.S. Kitchen Furniture retail market, the online share is 33.3% and will increase by an average of 3.4% to 38.1% by 2028.
Source: WorldFurnitureOnline | ecommmercedb
Also Read
General Kitchenware Statistics
- Kitchenware Market size is expected to be worth around USD 107.0 Bn by 2032 from USD 71.6 Bn in 2022, growing at a CAGR of 4.2% during the forecast period from 2023 to 2032.
- The revenue generated in the Kitchenware market in 2024 amounts to US$6.45bn.
- Based on projections, the market is expected to experience an annual growth rate of 3.31% (CAGR 2024-2029).
- It is worth noting that in the United States generates the highest revenue in the global comparison, with US$6.45bn in 2024.
- When considering the population figures, the per person revenue in 2024 is estimated to be US$18.87.
- Kitchenware market in the United States is experiencing a surge in demand for eco-friendly and sustainable products.
- Industry revenue has grown at a CAGR of 7.7% over the past five years, to reach an estimated $10.4bn in 2023.
The kitchen industry is booming in the eCommerce space, presenting significant opportunities for businesses. The latest statistics highlight the importance of a strong online presence.
At ColorWhistle, we specialize in eCommerce website development for the kitchen industry. Our expertise ensures your business can harness the latest trends and insights to thrive online. With our tailored digital solutions, we help you build an attractive and effective eCommerce website that stands out in the competitive market.
If you need expert assistance send a message or give us a call at +1 (919) 234-5140, and we’ll promptly respond to your inquiry.
What’s Next?
Now that you’ve had the chance to explore our blog, it’s time to take the next step and see what opportunities await!