How to Communicate Effectively via Infographics

Anusha is a digital strategy expert with deep expertise in branding, UI/UX, and performance-focused content. She brings advanced insight into brands to scale intelligently, blending creativity with conversion-focused thinking.
Our authors are proven experts in their fields, writing on topics where they have demonstrated expertise. Every piece of content undergoes peer review and validation by industry professionals.
AI Summary
Key Highlights of Communicating Effectively with Infographics
This post explores how to use infographics to communicate complex information clearly and engagingly. The key insight: infographics simplify data through visuals, making messages easier to understand and share than text alone. It guides business audiences on defining purpose, using strong visuals, telling stories, and promoting their infographics to boost engagement and brand presence. Emphasizing accuracy, clarity, and audience relevance, the article offers practical tips to create impactful designs. The real-world outcome is enhanced information retention, wider reach via social sharing, and stronger communication effectiveness in marketing campaigns.
Infographics are a great way to communicate complex information in an easy-to-understand, visually appealing manner. But simply producing high-quality graphics isn’t enough – you must ensure that your infographics actually communicate effectively with your audience.
To do this, there are several strategies and techniques that can dramatically improve the impact of your visuals. In this article, we’ll provide our insight on how you can use infographics more effectively in order to drive engagement among business audiences and maximize their success. We may even throw some data visualization tips into the mix as well!
Why An Infographic Is Better Than A Bunch Of Text?
Infographics are a powerful tool for communicating complex information in a clear and concise way. They are designed to be visually appealing and engaging, using a combination of icons, images, and charts to illustrate concepts and data. Compared to a large block of text, infographics are more effective at capturing the audience’s attention and keeping them interested.
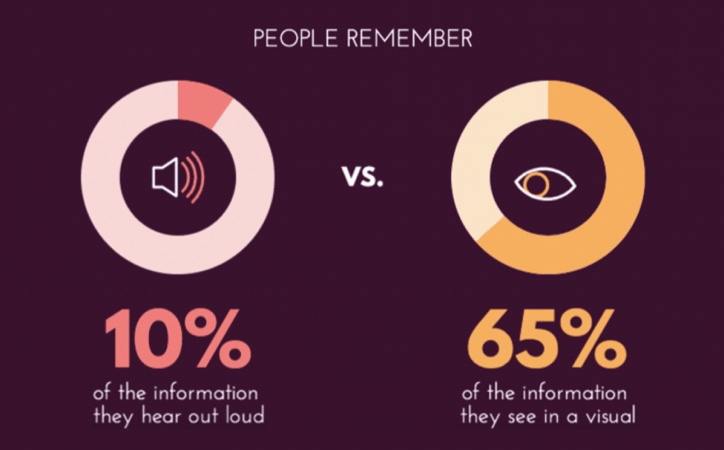
One of the main benefits of infographics is their ability to simplify complex information. By using visual elements, infographics can break down complex concepts into easy-to-understand segments, making the information more accessible and digestible for the audience. This saves the audience time and effort in trying to understand the material and increases information retention, helping people remember the information more easily.
Infographics are also highly shareable on social media platforms, which can be an effective way to reach a larger audience and promote brand awareness. With their eye-catching designs and concise messaging, infographics can quickly capture the attention of viewers and encourage them to share the content with their networks With the right social media creative design, and Strategy infographics can be a powerful tool for businesses to engage their audience and increase their online presence..
An infographic is more visually appealing than a block of text.
People are more likely to engage with an infographic than a block of text because it is more visually appealing. An infographic can communicate a lot of information in a concise and visually appealing way, which is more likely to engage readers.
An infographic is easier to understand than a block of text.
An infographic is easier to understand than a block of text because it uses visuals to communicate information. The use of visuals makes it easier for people to comprehend the information being presented.
An infographic is more shareable than a block of text.
An infographic is more shareable than a block of text because it is visually appealing and easy to understand. People are more likely to share an infographic that they found interesting or helpful, which can help to increase its reach.
An infographic can communicate complex information in a simple way.
An infographic can communicate complex information in a simple way because it uses visuals to convey meaning. This makes it easier for people to understand complex concepts that might be difficult to grasp from reading a block of text.
An infographic can be customized to meet the audience’s needs.
An infographic can be customized to meet the needs of the audience by including only the most relevant information and using visuals that appeal to the target audience. This ensures that people who see the infographic will be able to understand and appreciate the information being presented.
An infographic can be used to tell a story.
An infographic can be used to tell a story by using visuals and data to convey meaning and emotion. This makes it an effective tool for communicating messages that need to resonate with the audience on an emotional level.
Also, an infographic can be used to promote a brand or product by featuring the logo prominently and using colors and fonts that are associated with the brand. Overall, infographics are a powerful tool for communicating information in a way that is engaging, easy to understand, and memorable.
Tips To Create Effective Infographics That Resonate Well With Your Audience
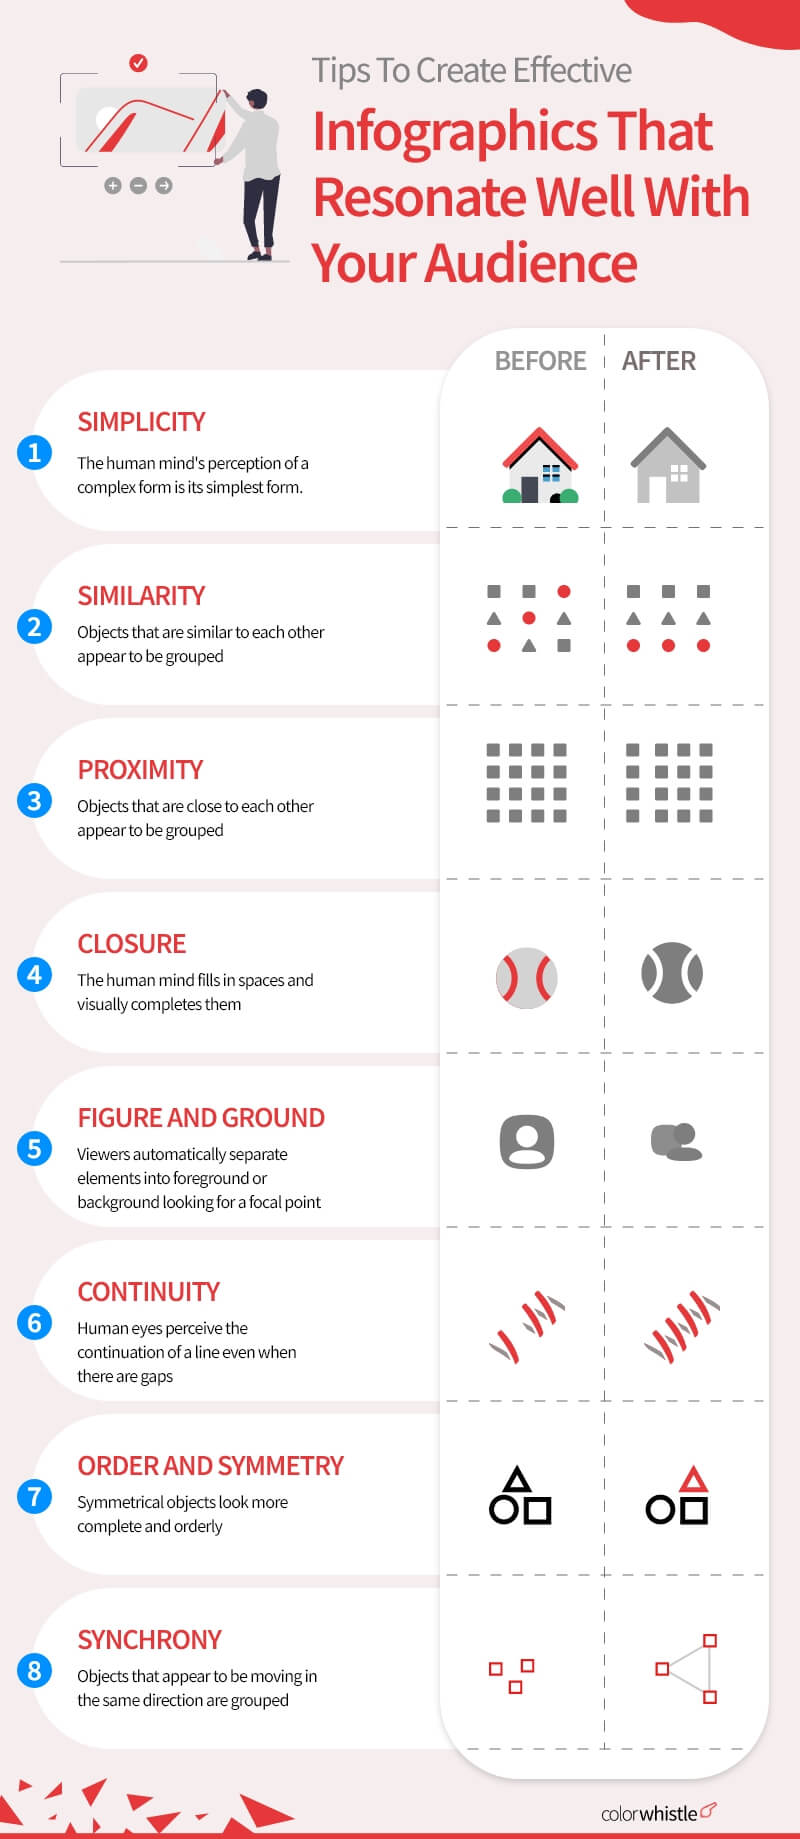
Infographics are an effective way to engage your audience and communicate vast amounts of information in a concise, entertaining format. Here’s how you can create compelling infographics that leave a lasting impact on viewers!
Define your purpose and audience
Before you start creating your infographic, it’s important to define your purpose and audience. What are you trying to communicate with your infographic? Who are you trying to reach? Answering these questions will help you determine what information to include and how to design your infographic in a way that resonates with your audience.
Keep it simple
When it comes to infographics, less is more. You want to include only the most important information and present it in a way that is easy for people to understand. Using too much text or complex graphics will only serve to confuse your audience and make your infographic less effective.
Use strong visuals
An infographic is all about visuals, so it’s important to use strong visuals that effectively communicate your message. Choose images and graphics that are high quality and eye-catching, and be sure to use colors that complement each other well.
Tell a story
A good infographic should tell a story that engages the reader and helps them understand the information being presented. When designing your infographic, think about how you can present the data in a way that will be interesting and easy for people to follow.
Use fonts wisely
The fonts you use in your infographic can have a big impact on its overall look and feel. When choosing fonts, be sure to pick ones that are easy to read and that complement the overall design of your infographic. Avoid using too many different fonts, as this can make your infographic look cluttered and confusing.
Give credit where credit is due
If you use any data or images from another source in your infographic, be sure to give credit where credit is due. This not only helps to avoid plagiarism, but it also shows that you’re willing to source reliable information for your readers. Include citations at the bottom of your infographic or in a separate section if there is space.
Promote your infographic
Once you’ve created your amazing infographic, it’s time to promote it! Share it on social media, embed it on your website or blog, or submit it to directories and forums related to your topic. The more people who see your infographic, the more effective it will be at achieving its purpose. Influence the power of social media graphic design to enhance the visual appeal of your infographic, making it more shareable and engaging across various platforms.
Review and revise as needed
Even the best infographics can always be improved upon. After you’ve published yours, take some time to review it and see if there are any areas where you could make changes or additions.
Here is our ColorWhistle Pinterest board on all infographics that we felt had a good meaning in them. Do visit and have a look
Create Infographics that Work For You
An infographic can be considered informative if it effectively communicates its intended message to its audience.
Here are five points that can help determine whether an infographic is informative:
- Accurate and reliable information: The infographic should contain accurate and trustworthy information, which has been sourced from credible and authoritative sources.
- Clear and concise messaging: The infographic should be designed to convey its message in a clear and concise manner, using simple language and appropriate visuals.
- Engaging and visually appealing design: A good infographic should be visually attractive, engaging, and easy to read, using appropriate fonts, colors, and design elements to help convey its message.
- Effective use of data visualization: If the infographic presents data, it should use effective data visualization techniques such as charts, graphs, or diagrams to help the audience understand the information being presented.
- Relevant to the target audience: The infographic should be relevant to the target audience, addressing their interests, needs, and concerns. It should be designed to capture their attention and engage them with the information being presented.
Looking for Designing & Branding Services / Solutions?
Seize and experience the transformative impact of Design and Branding Services & Solutions with ColorWhistle.

In conclusion, effective communication through infographics can bring to light complicated data in an easily digestible format, which makes viewers and readers more likely to remember the information.
In order to succeed in conveying the right message, choosing an appropriate design looks is critical. Besides creating a captivating infographic, it’s important to ensure the accuracy of all facts and figures before you publish the content.
Here at ColorWhistle, we have designers who are well-trained in how to create a visually stimulating and informative infographic that will catch viewers’ attention and be a great help for your business or marketing campaign. Start with us your graphic design services today!
So if you have any questions about utilizing this form of communication or need assistance with designs contact us via our contact page or give us a call at +1 91923 45140 – we’ll be happy to help!
In quest of the Perfect Design & Branding Solutions Buddy?
Be unrestricted to click the other trendy writes under this title that suits your needs the best!
- Best Branding Practices to Increase Your Brand Power!
- Manufacturing Product Configurators That Help You Move In Customer-Centric Direction
- Technology Outsourcing Services – Statistics & Trends
- Razorpay Integrations: Online Business Payment Gateway Pocketbook
- Online Businesses That Did Amazingly Well Even in Pandemic
What’s Next?
Now that you’ve had the chance to explore our blog, it’s time to take the next step and see what opportunities await!